
Enterprise Business Intelligence – Guide
Business environments and organizations constantly seek ways to gain a competitive edge and make more informed decisions. One critical tool that can help achieve this is Business Intelligence (BI).

Enterprise Business Intelligence takes this concept a step further by focusing on providing insights and analytics at an organization-wide level. This means leveraging BI tools and technologies to analyze individual departments or teams and provide a comprehensive view of the entire organization's performance.
What is Enterprise Business Intelligence?
BI is a technology-driven process that leverages software and services to transform data into actionable insights that inform strategic and tactical business decisions. BI tools access and analyze data sets and present analytical findings in reports, summaries, dashboards, graphs, charts, and maps.
Enterprise BI refers to the processes, technologies, and tools that help organizations analyze and visualize their business data to make informed decisions.
How to Choose the Right Enterprise Business Intelligence Platform?
It's essential for organizations seeking to make informed decisions to choose the correct enterprise business intelligence (BI) platform. Here are some steps to guide you through the selection process:
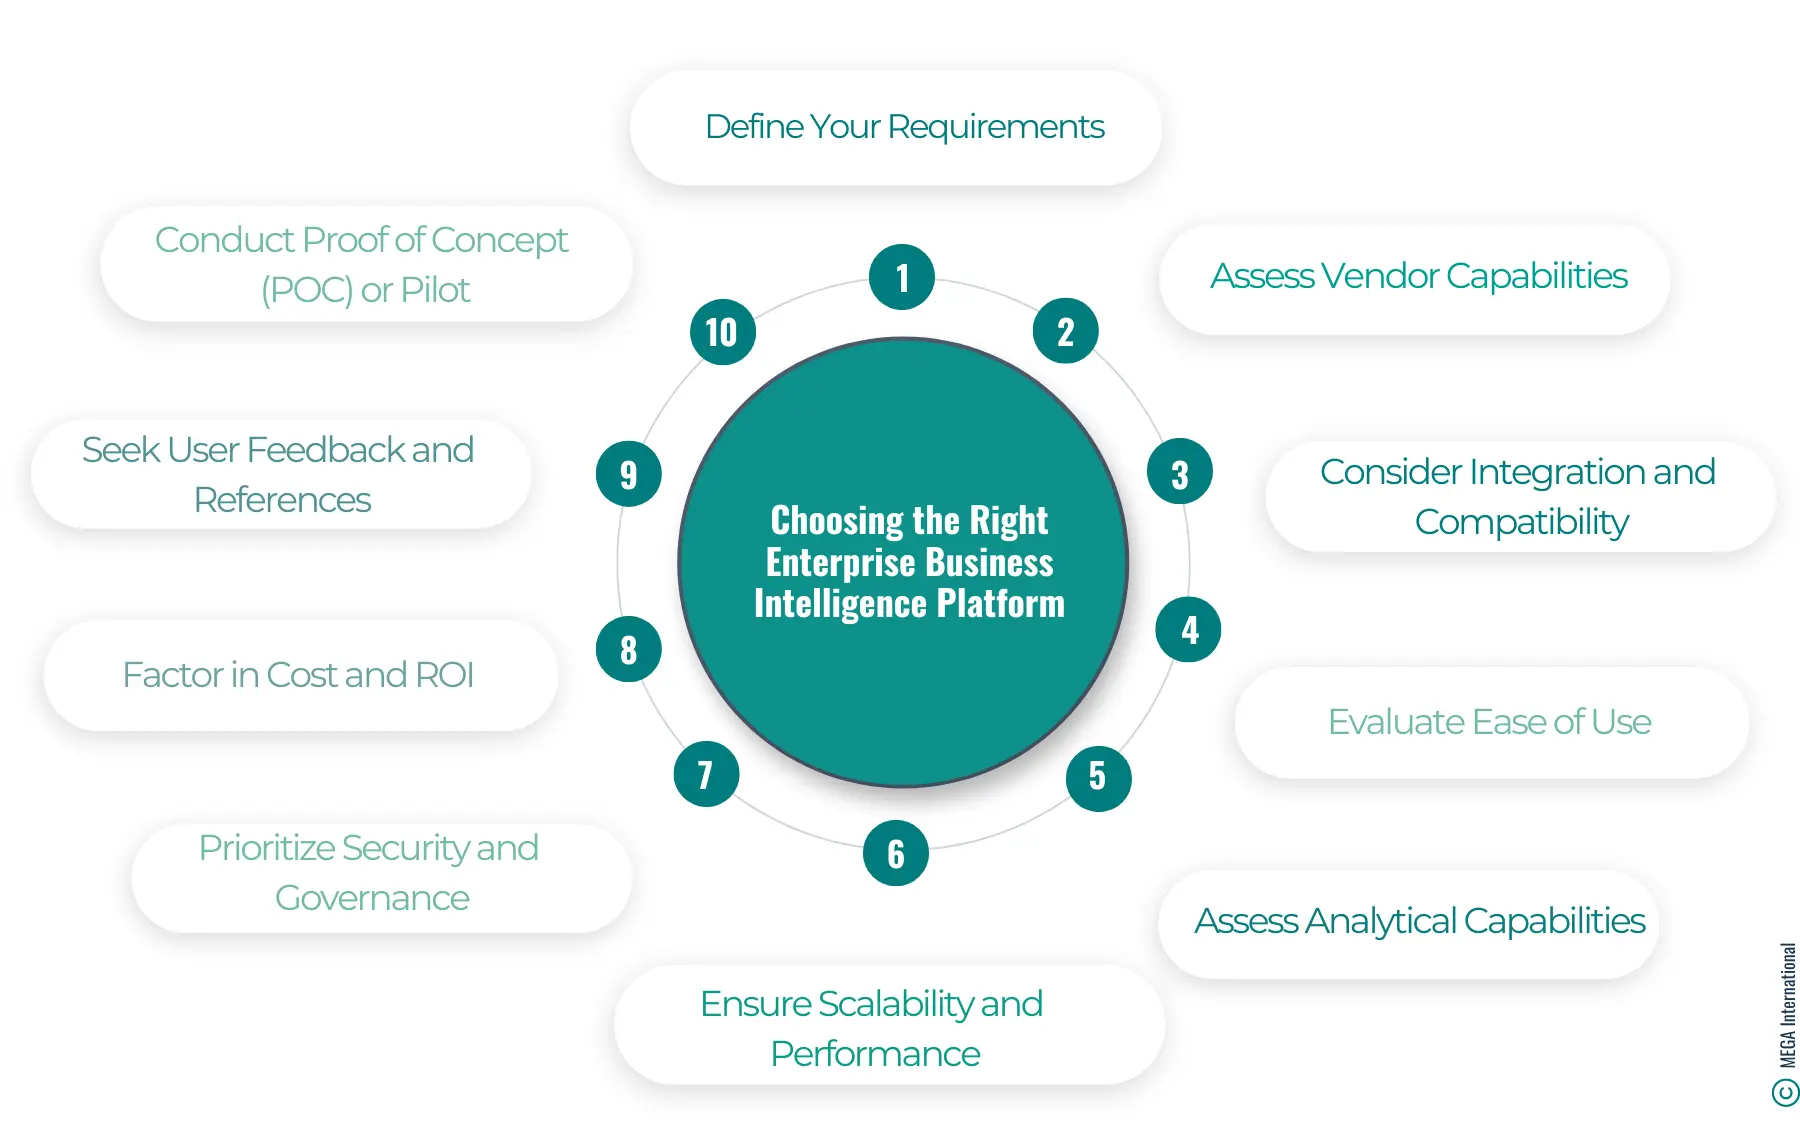
1. Define Your Requirements:
Identify your organization's specific BI needs, such as data integration, reporting, analytics, visualization, scalability, and security.
Consider the types of data sources you need to connect to, the volume of data you'll be handling, and the complexity of analysis required.
2. Assess Vendor Capabilities:
Evaluate the capabilities and expertise of BI platform vendors to meet your requirements.
Look for vendors with a track record of successful implementations in your industry or similar use cases.
Consider factors like vendor reputation, customer support, and long-term viability.
3. Consider Integration and Compatibility:
Ensure the BI platform integrates seamlessly with your existing systems, databases, and applications.
Evaluate compatibility with your preferred operating systems, databases, and cloud platforms.
Assess the ease of integration and any additional costs or complexities involved.
4. Evaluate Ease of Use:
Choose a BI platform with a user-friendly interface and intuitive tools that match the technical proficiency of your users.
Look for features like drag-and-drop interfaces, self-service capabilities, and customizable dashboards to empower users across the organization.
5. Assess Analytical Capabilities:
Consider the depth and breadth of the BI platform's analytics capabilities, including querying, reporting, OLAP, data mining, and predictive analytics.
Evaluate the platform's ability to handle advanced analytics techniques like machine learning and AI for predictive insights.
6. Ensure Scalability and Performance:
Assess the scalability of the BI platform to accommodate growing data volumes, user concurrency, and future expansion.
Consider performance factors such as data processing speed, query performance, and analytics capabilities.
7. Prioritize Security and Governance:
Choose a BI platform with robust security features to protect sensitive data and comply with regulatory requirements.
Evaluate features like data encryption, access controls, audit trails, and compliance certifications.
Consider governance features for managing data quality, metadata, and user permissions.
8. Factor in Cost and ROI:
Consider the BI platform's total cost of ownership (TCO), including licensing fees, implementation costs, training, and ongoing maintenance.
Assess the potential return on investment (ROI) regarding improved decision-making, operational efficiency, and business outcomes.
9. Seek User Feedback and References:
Gather feedback from users and stakeholders using the BI platform daily.
Seek references and case studies from existing customers to understand their experiences with the platform and vendor.
10. Conduct Proof of Concept (POC) or Pilot:
Consider conducting a proof of concept or pilot project to evaluate the BI platform's suitability for your organization's needs.
Test the platform with accurate data and use cases to validate its performance, usability, and alignment with your requirements.
Factors to Consider and Key Features to Look for in an Enterprise BI Platform
Important features to look for in an enterprise BI platform include self-service BI tools, easy integration with various data sources, advanced data reporting capabilities, and support for machine learning algorithms for predictive analysis.
Here are some steps to guide you through this process:
- Requirements: Identify your organization's specific BI needs, including data integration, reporting, analytics, visualization, scalability, and security.
- Vendor Capabilities: Evaluate vendors based on their expertise, reputation, customer support, and track record of successful implementations.
- Integration and Compatibility: Ensure seamless integration with existing systems, databases, applications, and compatibility with preferred platforms.
- Ease of Use: Choose a user-friendly platform with intuitive tools, self-service capabilities, and customizable dashboards.
- Analytical Capabilities: Assess the depth and breadth of analytics features, including querying, reporting, OLAP, data mining, and predictive analytics.
- Scalability and Performance: Consider the platform's scalability to handle growing data volumes, user concurrency, and performance factors like data processing speed and analytics.
- Security and Governance: Prioritize robust security features, access controls, encryption, audit trails, and compliance with regulatory requirements.
- Cost and ROI: Evaluate the total cost of ownership (TCO) and potential return on investment (ROI) for improved decision-making and operational efficiency.
- User Feedback and References: Gather user feedback and seek references from existing customers to understand their experiences with the platform.
- Proof of Concept (POC) or Pilot: Consider conducting a POC or pilot project to validate the platform's suitability with actual data and use cases.
Comparison of Top Enterprise BI PlatformsSome of the top enterprise BI platforms in the market include Microsoft Azure, Tableau, and Power BI. Each platform offers unique features and capabilities for data visualization, analytics, and reporting to support informed decision-making. |

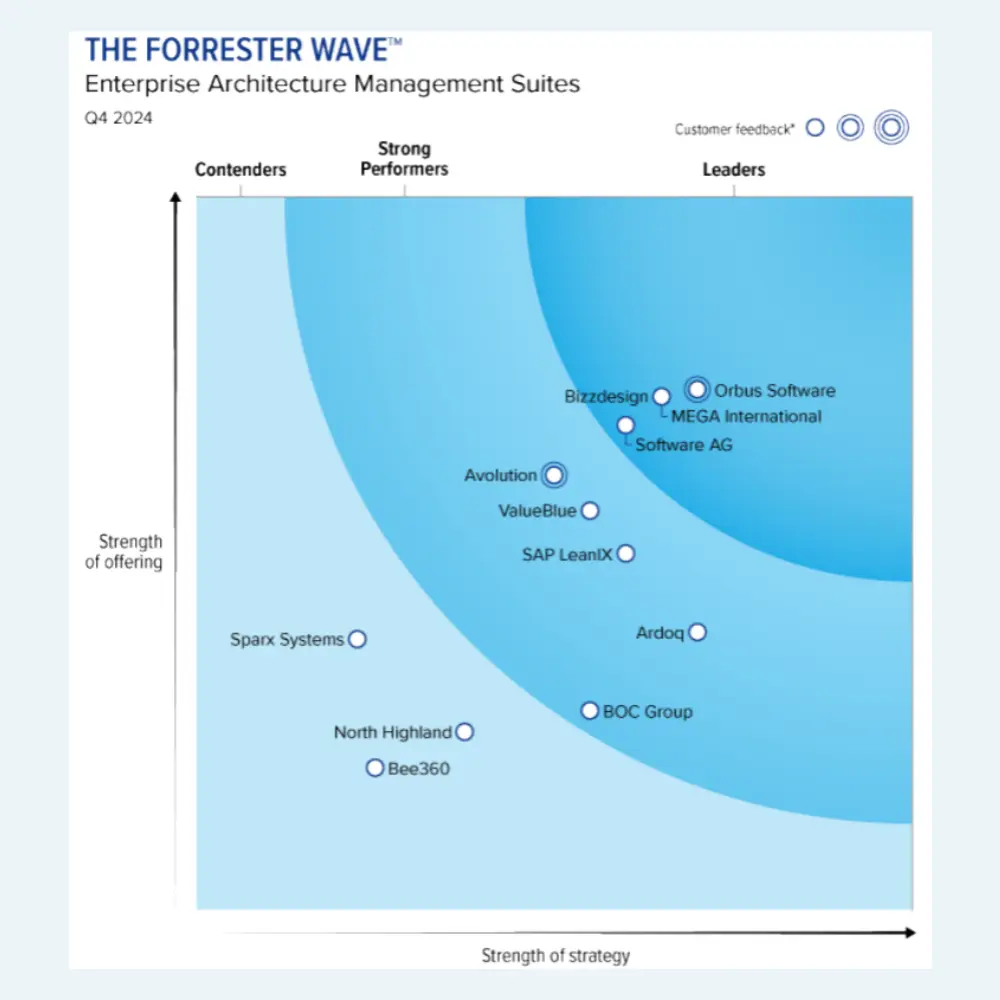
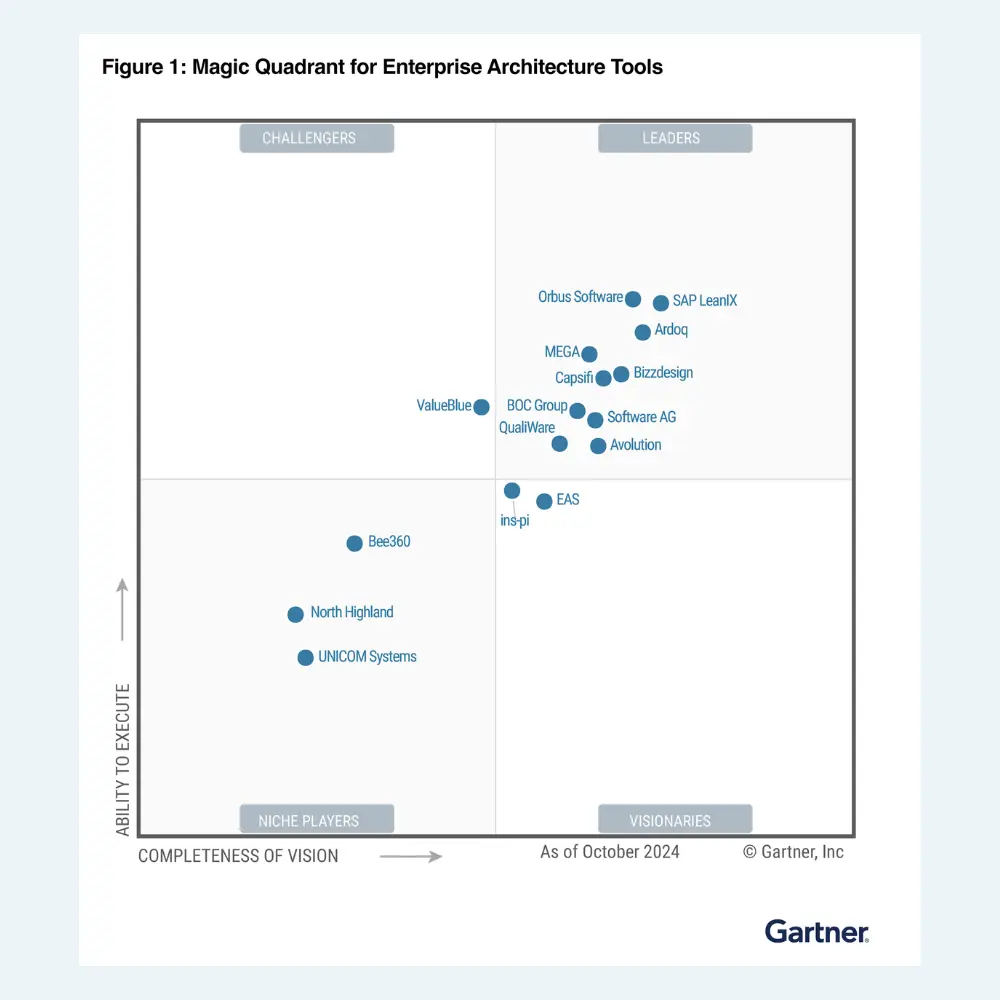
Get a complimentary copy: 2024 Gartner® Magic Quadrant™ for Enterprise Architecture Tools
What are the Key Capabilities of Enterprise Business Intelligence?
The critical capabilities of enterprise business intelligence (BI) encompass a range of functions and features that enable organizations to collect, analyze, and visualize data to support decision-making.
Needed capabilities:
Real-time Data Integration
- Streaming Data Sources: Connect to and ingest data from streaming sources such as IoT devices, sensors, social media feeds, and transactional systems.
- Event Processing: Process and analyze events in real-time, enabling immediate insights and responses to change conditions.
- Low-Latency Pipelines: Implement low-latency data pipelines to minimize delays in processing and analyzing streaming data.
Real-time Analytics
- In-Memory Processing: Utilize in-memory processing and caching techniques to enable data analysis without persisting it to disk.
- Complex Event Processing (CEP): Identify patterns, trends, and anomalies in streaming data using CEP engines and algorithms.
- Predictive Analytics: Apply machine learning and predictive models to real-time data streams to forecast future outcomes and trends.
Real-time Visualization
- Live Dashboards: Display data and analytics on interactive dashboards to provide stakeholders with up-to-the-minute insights.
- Dynamic Updates: Enable dynamic updates and refreshes of visualizations as new data arrives, ensuring users have access to the latest information.
- Alerting and Notifications: Trigger alerts and notifications based on predefined thresholds or conditions detected in data streams.
Real-time Decision-Making
- Operational Dashboards: Empower operational users with dashboards that provide real-time visibility into key metrics and performance indicators.
- Automated Decision Support: Implement automated decision support systems that analyze data and recommend or trigger actions based on predefined rules or algorithms.
- Collaborative Workflows: Facilitate team collaboration and decision-making by sharing, discussing, and annotating insights.
Real-time Data Governance and Security
- Real-time Monitoring: Monitor real-time data access, usage, and security events to detect and respond to potential threats or compliance violations.
- Policy Enforcement: Enforce real-time data governance policies and security controls to ensure data integrity, confidentiality, and regulation compliance.
- Auditing and Logging: Capture audit logs and activity trails to track changes and access sensitive data in the BI environment.
Data Integration
- Extract, Transform, Load (ETL): Ability to extract data from various sources, transform it into a unified format, and load it into a centralized repository.
- Data Connectivity: Support for connecting to diverse data sources, including databases, data warehouses, cloud services, spreadsheets, and web APIs.
Data Warehousing
- Centralized Repository: Store data in a centralized repository optimized for reporting, analysis, and performance.
- Data Modeling: Design and manage data models to organize and structure data for analytical purposes.
Data Analytics
- Querying and Reporting: Execute queries and generate reports to analyze historical data and answer specific business questions.
- Online Analytical Processing (OLAP): Perform multidimensional analysis to explore data from different perspectives and dimensions.
- Advanced Analytics: Apply statistical analysis, data mining, predictive modeling, and machine learning techniques to uncover insights and patterns in the data.
- Real-Time Analytics: Analyze streaming data in
to gain immediate insights and respond to changing conditions.
Data Visualization:
- Charts and Graphs: Use charts, graphs, maps, and other graphical elements to visually represent data.
- Dashboards: Build interactive dashboards to visualize key performance indicators (KPIs), metrics, and trends at a glance.
- Interactive Tools: Provide tools for users to explore data interactively, drill down into details, and filter information dynamically.
Self-Service BI
- Ad-Hoc Reporting: Empower business users to create ad-hoc reports and queries without IT assistance.
- Data Discovery: Facilitate data discovery and exploration through intuitive interfaces and self-service analytics tools.
- Data Preparation: Assist users in preparing and cleansing data for analysis through automated tools and workflows.
Collaboration and Sharing
- Sharing and Distribution: Share reports, dashboards, and insights with stakeholders through email, portals, and collaboration platforms.
- Annotation and Commentary: Enable users to annotate, comment on, and discuss insights within the BI platform.
- Collaborative Decision-Making: Support collaborative decision-making by facilitating discussions and knowledge sharing around data.
Performance Management
- Key Performance Indicators (KPIs): Define, track, and monitor KPIs to measure performance against organizational goals and objectives.
- Scorecards and Strategy Maps: Visualize performance metrics and strategic objectives using scorecards and strategy maps.
- Performance Monitoring: Monitor performance and receive alerts for deviations from targets or thresholds.
Governance and Security
- Data Governance: Establish policies, procedures, and standards for data quality, integrity, and security.
- Access Controls: Control data and BI content access based on user roles, permissions, and authentication mechanisms.
- Audit Trails: Maintain audit trails to track data access, changes, and usage for compliance and accountability.
Scalability and Performance
- Scalable Architecture: Scale the BI platform to handle growing data volumes, user concurrency, and analytical workloads.
- Performance Optimization: Optimize query performance, data processing speed, and system responsiveness for efficient analytics.
Mobile BI
- Mobile Access: Access BI content and functionality on mobile devices, including smartphones and tablets.
- Responsive Design: Optimize user interfaces and dashboards for screen sizes and mobile devices.
| These capabilities empower organizations to leverage data effectively, unlocking actionable insights for improved decision-making, enhancing operational efficiency, and securing a competitive edge in the current data-centric business environment. |
How to Develop an Effective Enterprise Business Intelligence Strategy?
Here's a step-by-step guide to developing an effective BI strategy:
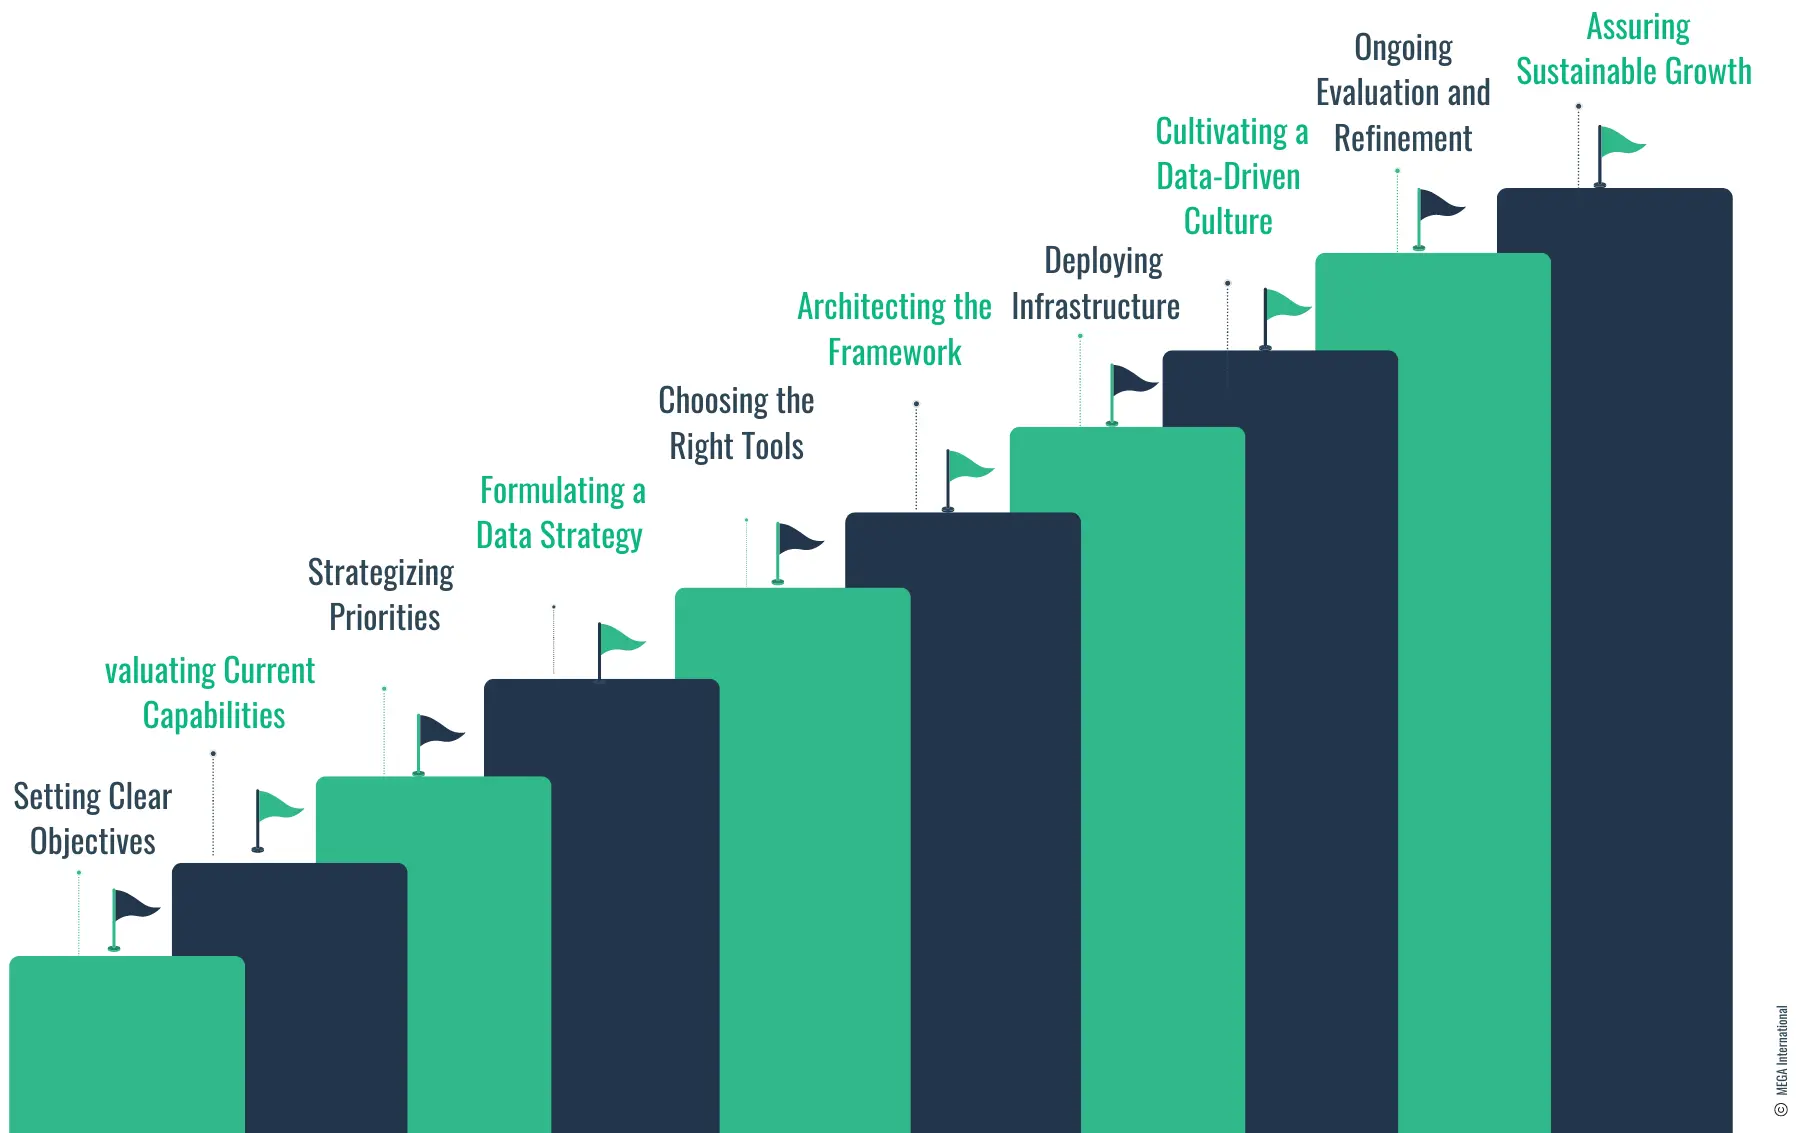
1. Setting Clear Objectives
Begin by aligning the BI initiatives with the overarching business goals to ensure a unified direction.
2. Evaluating Current Capabilities
Conduct a thorough assessment of your existing BI tools and processes to identify any deficiencies or areas for improvement.
3. Strategizing Priorities
Concentrate efforts on projects with potentially significant impact, ensuring they align with your strategic objectives.
4. Formulating a Data Strategy
Develop a comprehensive data management plan for governance, integration practices, and high data quality standards.
5. Choosing the Right Tools
Opt for BI solutions that meet your technical specifications and effectively address the end-user's needs.
6. Architecting the Framework
Establish clear KPIs, along with designing intuitive dashboards and reports, to facilitate insightful data analysis.
7. Deploying Infrastructure
Set up a robust data storage solution, such as a data warehouse or lake, and integrate your selected BI tools for seamless operation.
8. Cultivating a Data-Driven Culture
Engage with all stakeholders through education and training to champion data-driven decision-making across the organization.
9. Ongoing Evaluation and Refinement
Regularly measure the BI strategy's performance, solicit feedback, and be prepared to make iterative improvements.
10. Assuring Sustainable Growth
Plan meticulously for future scalability, ensuring the security of your data and the resilience of your BI operations against potential disruptions.
Benefits of Implementing Enterprise BI
Implementing Enterprise BI offers several benefits, such as:
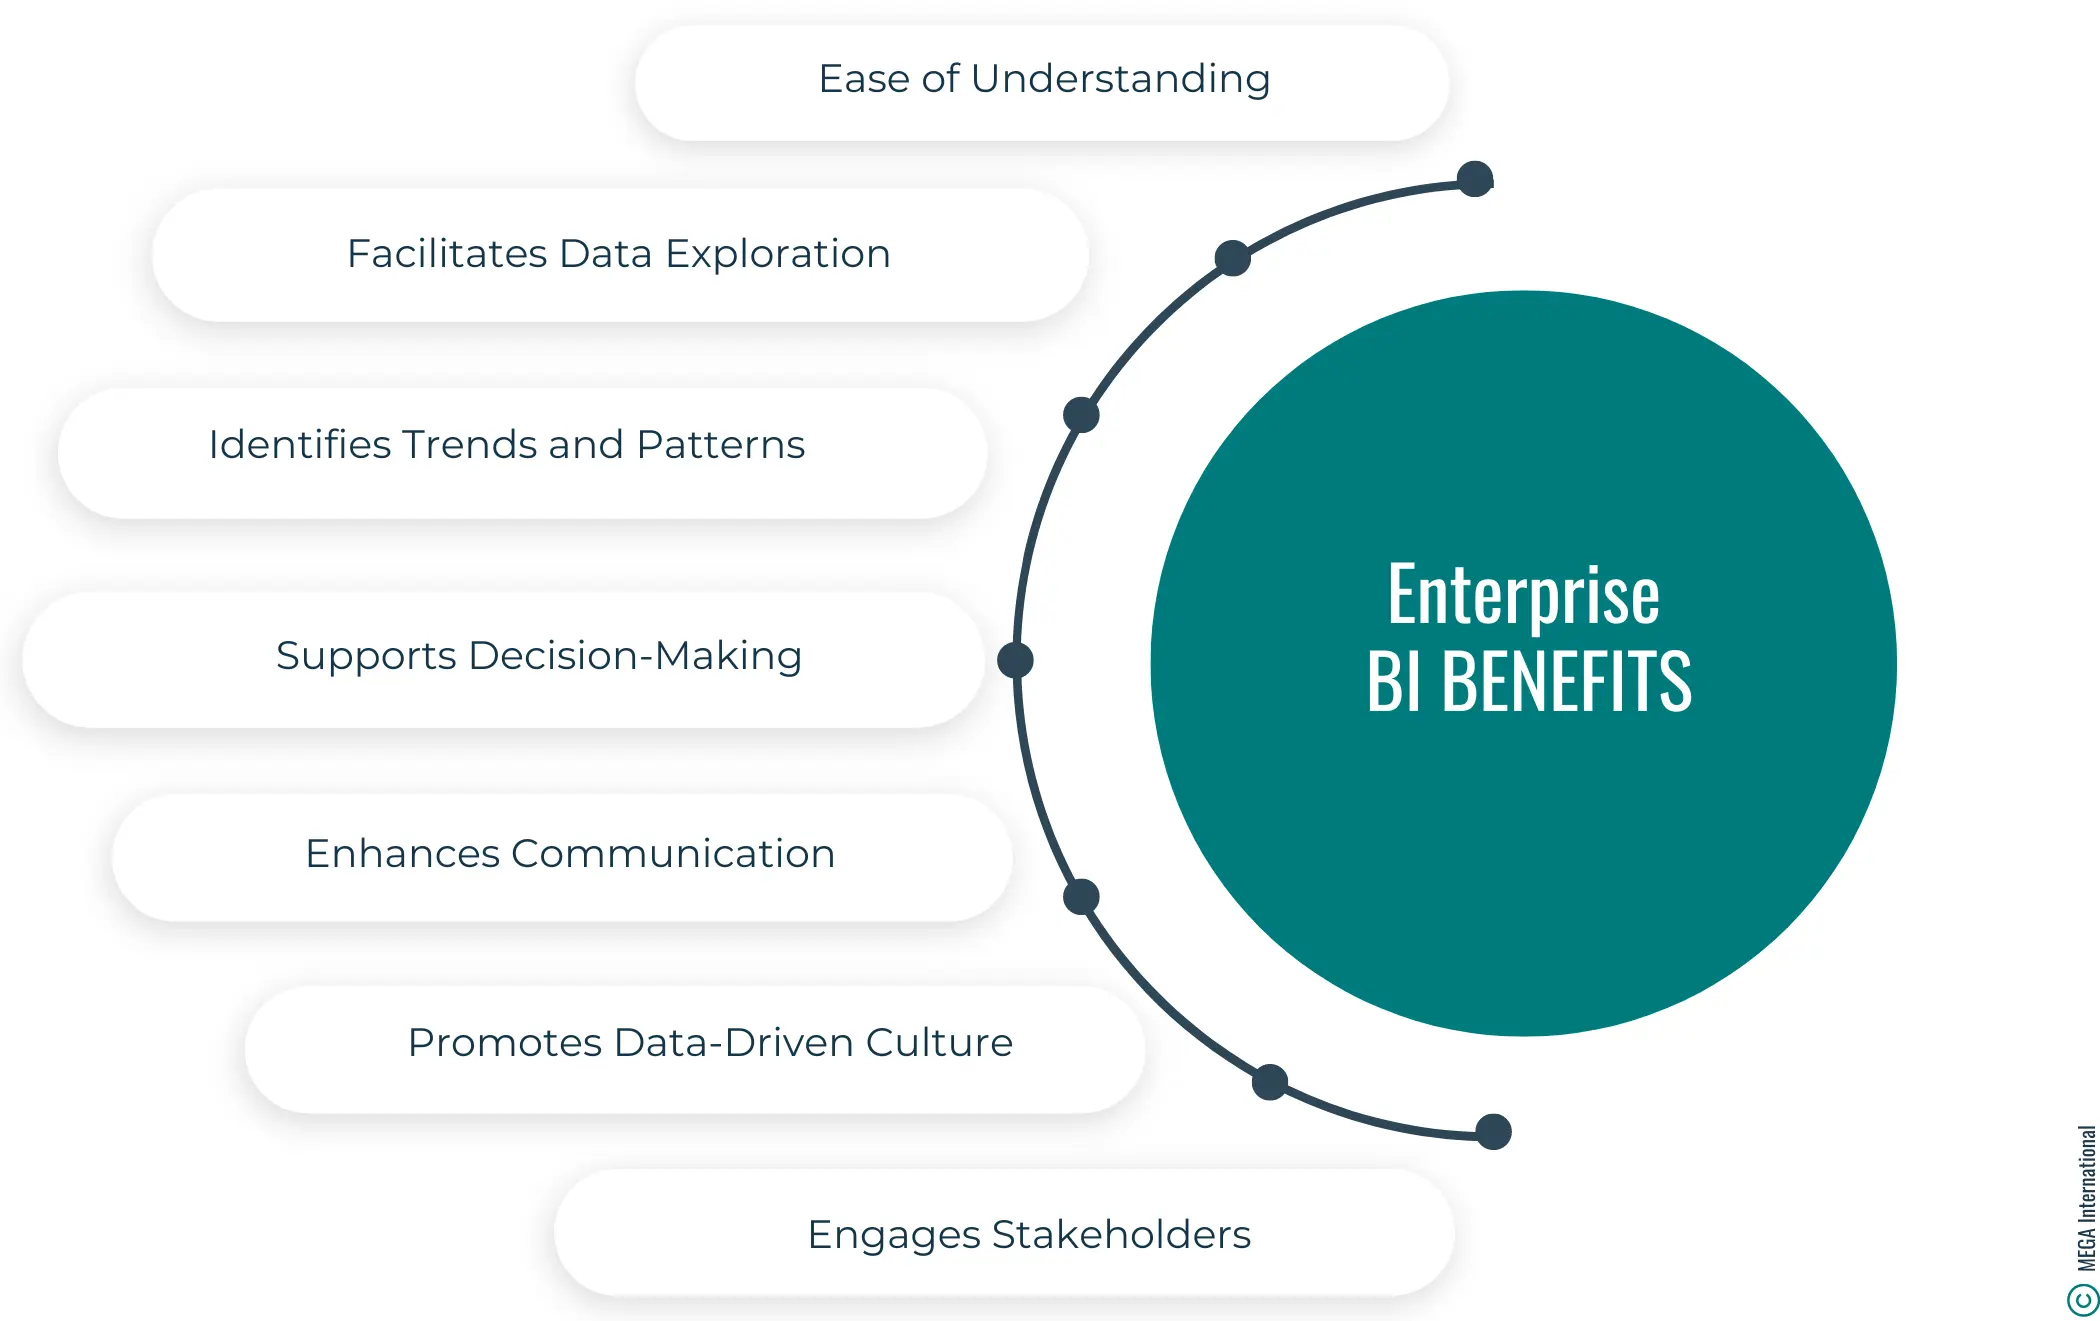
Ease of Understanding
Visual representations of data, such as charts, graphs, and dashboards, make complex information more digestible and comprehensible to a broader audience. Decision-makers can quickly grasp trends, patterns, and insights by looking at visualizations, even if they are not data experts.
Facilitates Data Exploration
Interactive visualizations allow users to drill down into the data, filter it, and explore different perspectives easily. This capability enables users to uncover deeper insights and ask ad-hoc questions without the need for predefined reports.
Identifies Trends and Patterns
Visualization makes it easier to spot trends, patterns, correlations, and outliers within the data that may not be immediately apparent from raw numbers or text. This helps organizations identify opportunities, risks, and areas for improvement.
Supports Decision-Making
Visualizations provide decision-makers with timely and relevant information in an easy-to-interpret format. Visualizations empower decision-makers to make informed choices quickly, whether they're monitoring key performance indicators, tracking progress toward goals, or assessing the impact of strategic initiatives.
Enhances Communication
Visualizations are a common language for communicating data-driven insights across departments and organizational stakeholders. They facilitate discussions, presentations, and collaboration by clearly and concisely representing the data.
Promotes Data-Driven Culture
By making data more accessible and understandable, visualization encourages a culture of data-driven decision-making within an organization. When employees can see the impact of their actions reflected in visualizations, they are more likely to use data to guide their decisions and actions.
Engages Stakeholders
Visualizations are engaging and compelling, capturing the attention of stakeholders and encouraging them to interact with the data. This engagement fosters a deeper understanding of the business and encourages stakeholders to take ownership of the data and its implications.
Enterprise Business Intelligence and AI
Enterprise Business Intelligence (BI) and Artificial Intelligence (AI) are two complementary technologies that, when combined, can significantly enhance an organization's ability to extract insights from data and make informed decisions. Here's how they intersect:
Data Analysis and Insights:
- BI traditionally focuses on descriptive analytics, providing insights into what has happened in the past based on historical data.
- Conversely, AI enables predictive and prescriptive analytics by leveraging machine learning algorithms to forecast future trends and recommend actions based on data patterns.
- Integrating AI capabilities into BI platforms enables organizations to understand historical performance, anticipate future outcomes, and proactively optimize business processes and outcomes.
Advanced Analytics:
- AI techniques such as machine learning, natural language processing (NLP), and computer vision can be integrated into BI platforms to perform advanced analytics tasks, such as anomaly detection, sentiment analysis, image recognition, and predictive modeling.
- By incorporating AI-driven analytics into BI workflows, organizations can uncover hidden patterns, correlations, and insights in their data that may not be immediately apparent through traditional BI approaches.
Automation and Decision Support:
- AI-powered automation capabilities can enhance BI by automating repetitive tasks like data preparation, report generation, and dashboard updates.
- AI-driven decision support systems can help users make better decisions by analyzing vast amounts of data, identifying relevant information, and providing actionable insights.
Personalization and Recommendation:
- AI algorithms can personalize BI experiences by tailoring dashboards, reports, and recommendations to individual users' specific needs and preferences.
- AI can deliver relevant and timely personalized insights and recommendations by analyzing user behavior, preferences, and interactions with BI content, driving user engagement and adoption.
Natural Language Processing (NLP):
- NLP capabilities enable users to interact with BI systems using natural language queries and commands, making accessing and analyzing data easier for non-technical users.
- AI-powered chatbots and virtual assistants can answer questions instantly, guide users through data analysis tasks, and surface relevant insights through conversational interfaces.
Augmented Analytics:
- Augmented analytics combines AI and BI to automate data preparation, analysis, and insight generation tasks, enabling users to focus on interpreting results and making decisions rather than wrangling data.
- Augmented analytics platforms can accelerate the BI process, reduce time to insight, and empower users with actionable intelligence by leveraging AI-driven insights.

How HOPEX Assists in Enterprise Business Intelligence
HOPEX enterprise architecture platform supports various aspects of business intelligence (BI) by providing tools and capabilities to manage data, processes, applications, and technology infrastructure. Here's how HOPEX can assist you with enterprise business intelligence:
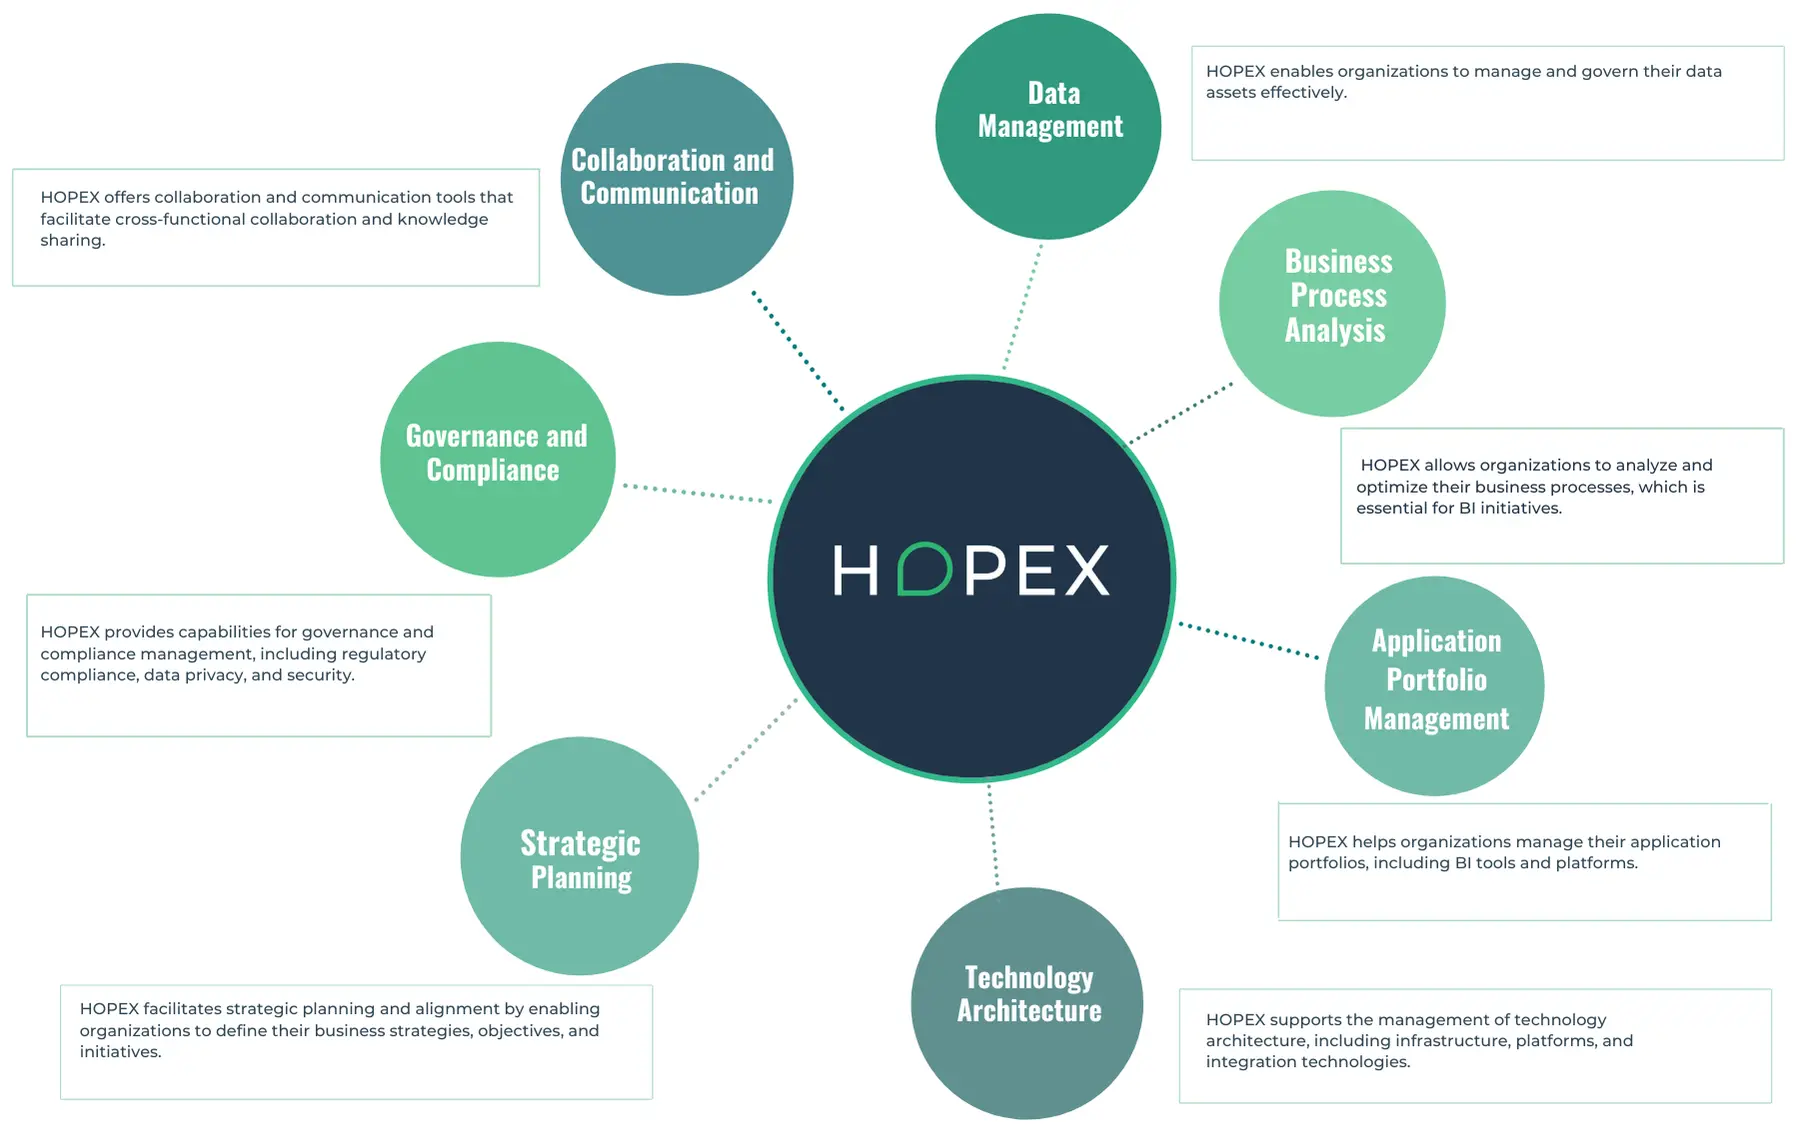
- Data Management: HOPEX enables organizations to manage and govern their data assets effectively. It provides capabilities for data modeling, metadata management, data lineage, and data quality management, ensuring that BI initiatives are built on a foundation of accurate, reliable, and well-understood data.
- Business Process Analysis: HOPEX allows organizations to analyze and optimize their business processes, which is essential for BI initiatives. By understanding how data flows through various processes, organizations can identify opportunities for improvement, streamline operations, and enhance data-driven decision-making.
- Application Portfolio Management: HOPEX helps organizations manage their application portfolios, including BI tools and platforms. By providing visibility into applications, dependencies, and usage, HOPEX enables organizations to rationalize their BI toolsets, reduce redundancy, and optimize investments in BI technology.
- Technology Architecture: HOPEX supports the management of technology architecture, including infrastructure, platforms, and integration technologies. This ensures the BI infrastructure is robust, scalable, and well-integrated with other enterprise systems, enabling efficient data processing and analysis.
- Strategic Planning: HOPEX facilitates strategic planning and alignment by enabling organizations to define their business strategies, objectives, and initiatives. Organizations can ensure that BI investments deliver maximum value and support long-term business goals by aligning BI initiatives with strategic priorities.
- Governance and Compliance: HOPEX provides capabilities for governance and compliance management, including regulatory compliance, data privacy, and security. By ensuring BI initiatives adhere to relevant regulations and internal policies, HOPEX helps organizations mitigate risks and maintain trust in their data and analytics.
- Collaboration and Communication: HOPEX offers collaboration and communication tools that facilitate cross-functional collaboration and knowledge sharing. This is essential for BI initiatives, as they often involve collaboration between business users, analysts, IT professionals, and other stakeholders to ensure that BI solutions meet business needs and requirements.

FAQs
An Enterprise BI Platform is a centralized system that enables organizations to collect, organize, and analyze business data from multiple sources. It provides a visualization dashboard, query capabilities, and tools for creating reports and visualizations.
Enterprise Business Intelligence enables organizations to analyze data in real-time, allowing business users to monitor key performance indicators, track business operations, and respond swiftly to changing market conditions.
An Enterprise BI solution provides self-service capabilities, enabling business users to analyze data without technical expertise. It also offers customizable dashboards, access to historical data, and advanced features like machine learning for deeper insights.
Enterprise BI plays a crucial role in data management by providing a centralized platform to store, process, and analyze business data. It helps ensure data security, improve data quality, and facilitate data-driven decisions at all levels of the organization.
When deploying an Enterprise BI strategy, organizations should focus on aligning BI initiatives with business goals, selecting the right BI tools, ensuring data governance, training staff on BI capabilities, and measuring the impact on business performance.


Enterprise Architecture Related Content
Shift from a documentation tool to an operational tool and accelerate business transformation
MEGA HOPEX for Enterprise Architecture
Request a demonstration of HOPEX for EA, and see how you can have immediate value of your projects.